Table of Contents
Unit 1 | Algebra
Page 1 | Expressions and Formulae
Page 3| Solving Linear Equations
Page 4| Expanding and Factorising
Page 5| Factorising Quadratics and expanding double brackets
Page 6| Patterns and Sequences
Page 7| Simultaneous Equations
Page 8| Changing the subject of a Formula
Page 9| Adding , subtracting algebraic formulas
Unit 2 |Graphs
Page 1 | Straight line graphs
Page 2 | Graphs of Quadratic functions
Unit 3 |Geometry and Measure
Page 2 | Symmetry
Page 3 | Coordinates
Page 4 | Perimeter, Area, Volume
Page 6 | Measurement
Page 7 | Trigonometry
Page 8 | Pythagoras
Page 9 | Angles
Page 10 | Shapes
Page 11| Time
Page 12 | Locus
Unit 4 | Numbers
Page 1 | Speed, Distance and time
Page 2 | Rounding and estimating
Page 3 | Ratio and proportion
Page 4 | Factors, Multiples and primes
Page 5 | Powers and roots
Page 7 | Positive and negative numbers
Page 8 | Basic operations
Page 9 | Fractions
Page 10 | Percentages
Unit 5 | Statistics and Probability
Page 1 | Sampling data (MA)
Page 2 | Recording and representing data
Page 3 | Mean median range and mode
Page 4 | Standard deviation
Unit 4 | Calculus
Tree Diagrams
Tree diagrams allow us to see all the possible outcomes of events. Essentially, they show a sequence of events e.g. toss the 1st coin and then toss the 2nd coin. They show all the possible outcomes in each event e.g. head/tail. Therefore we can work out all the possible ‘end results’ which could include head head, tail tail, head tail and head tail, for the events listed above.
Any event can be represented in tree diagrams along with many possible outcomes for each event.
Tip – In a question, you may need to identify the different events i.e. sequence of events.
Rules of Tree Diagrams
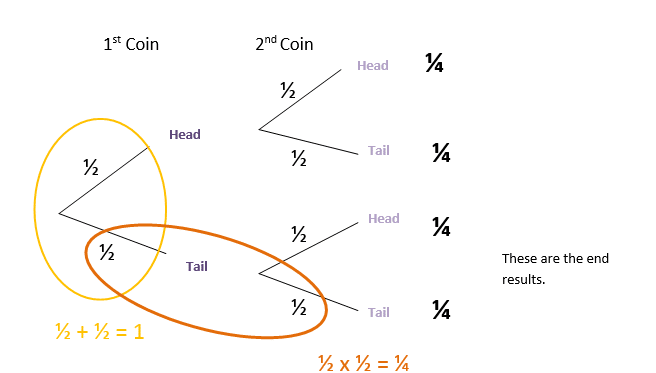
On any set of branches which all meet at a point, the probabilities on each branch must add up to 1.
Multiply along the branches to get the end results!
All the ‘end results’ i.e. the probabilities worked out at the end of each branch (by multiplication) should all add up to 1.
![]()
Example 1 :
1.
- ‘without replacement’– means that any marbles which are removed from the bag are not put back in. Hence, probabilities will change across the tree diagrams as you have fewer marbles overall and fewer marbles of the colour picked.
- ‘both marbles are the same colour’ – we are looking for any of the following occurring; red red or blue blue. We can show this on a tree diagram.
2.
Draw the tree diagram
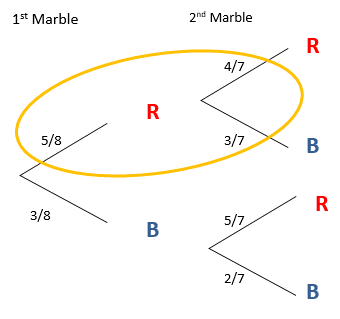
Let’s look at the first half of the diagram to see what’s going on.
The probability of picking a red marble on the first pick is simply 5/8. Now, once this red marble is picked, there are only 7 marbles left in the bag as the 1st marble is not replaced in this question. This is why the denominator of the fractions is 7.
There are now only 4 red marbles remaining so the probability of picking a red marble is 4/7. There are still 3 blue marbles left ( as a blue marble was not picked the first time), therefore the probability of picking a blue marble on the second pick is 3/7.
Follow this process to understand and work out all the probabilities needed in a tree diagram.
3.
Work out the ‘end results’ that fulfil the criteria stated in the question. In this case, the criterion is that both marbles are the same colour. Therefore we need to work out the end results for the branches red red and blue blue.
This branch is red
5/8 x 4/7 = 5/14
This branch is blue
3/8 x 2/7 = 3/28
4.
- Add together all the end results you worked out in step 3 i.e. the end results that fulfil the criteria of the 2 marbles picked being the same colour.
5/14 +3/28 = 13/28
Steps
- Read the question carefully. Look for whether the question is with replacement or not. Highlight any key points to the question so you fully understand what you are trying to find the probability of.
- Draw the tree diagram using information given in the question. Follow the branches along the tree diagram, filling the probabilities in one by one. Be careful whether the question is either ‘with replacement’ or ‘without replacement’ .
- Work out the ‘end results’ for the branches which fulfil the criteria stated in the question.
Remember – work out end results by multiplying along a branch!
- Add all the relevant end results together – this is your final answer
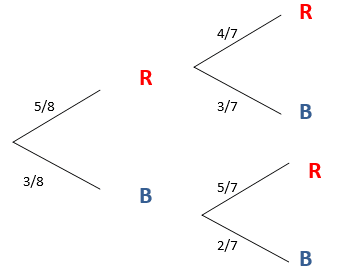
Below is the same probability question but as a ‘with replacement’ question so you can see how the probabilities are different.
Example 2 :
A bag contains 5 red marbles and 3 blue marbles. Two marbles are taken from the bag. The first marble is replaced. Using a tree diagram, find the probability that both marbles are the same colour.
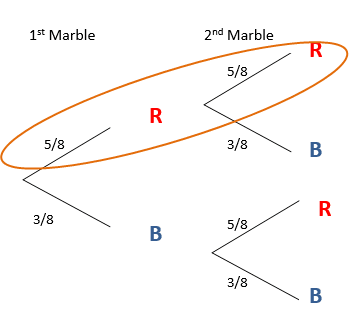
Let’s follow the first branch to understand what is going on.
The probability of selecting a red marble is 5/8. (There are 8 marbles in the bag and 5 are red). If a red marble is picked, it is then replaced i.e. it is put back into the bag. Therefore there are still 8 marbles in the bag and 5 red ones. This means that the probability of picking a red marble on the second pick is also 5/8
Question – work out the probability of picking two marbles the same colour using this tree diagram.
- There are 6 sweets and 4 lollipops in a pick ‘n mix bag. Susie chooses 2 items from the bag. Find the probability she picks two of the same items (i.e. two sweets of two lollipops). She does not replace any of the items she picks.
- Find the probability of throwing a dice three times and getting a six, another six and then an even number. Draw a tree diagram to help.
Tip – Your choices will be ‘even’ and ‘not even’, ‘six’ and ‘not 6’ .
- There are 6 red balls in a bag and 6 blue balls in a bag. Tracy picks two balls and replaces the first ball she picks. Find the probability she picks both balls of the same colour.
- There are 6 red balls in a bag and 6 blue balls in a bag. Tracy picks two balls and replaces the first ball she picks. Find the probability the two balls she picks are not the same colour.
- The probability that it rains is 0.7. The probability that Jen is late when it rains is 0.3. The probability that Jen is late when it does not rain is 0.5. Find the probability that is rains and Jen is late.
Tip – Your two events will be rain/not rain and late/not late. This is another example of conditional probability – the probabilities on a branch depend on what happened in the previous branch.
At Least questions
Remember the rule à 1-Probability of the ‘other outcome’
The probability of at least something happening = 1- Probability of the ‘other outcome’
Example 3 :
Find the probability of having at least one girl in 5 children.
(There are lots of ways that this could happen and would take too long to work out even when using a tree diagram.)
- Identify the ‘other outcome’. In this situation the ‘other outcome’ is ‘all 5 boys.’