Table of Contents
Unit 1 | Algebra
Page 1 | Expressions and Formulae
Page 3| Solving Linear Equations
Page 4| Expanding and Factorising
Page 5| Factorising Quadratics and expanding double brackets
Page 6| Patterns and Sequences
Page 7| Simultaneous Equations
Page 8| Changing the subject of a Formula
Page 9| Adding , subtracting algebraic formulas
Unit 2 |Graphs
Page 1 | Straight line graphs
Page 2 | Graphs of Quadratic functions
Unit 3 |Geometry and Measure
Page 2 | Symmetry
Page 3 | Coordinates
Page 4 | Perimeter, Area, Volume
Page 6 | Measurement
Page 7 | Trigonometry
Page 8 | Pythagoras
Page 9 | Angles
Page 10 | Shapes
Page 11| Time
Page 12 | Locus
Unit 4 | Numbers
Page 1 | Speed, Distance and time
Page 2 | Rounding and estimating
Page 3 | Ratio and proportion
Page 4 | Factors, Multiples and primes
Page 5 | Powers and roots
Page 7 | Positive and negative numbers
Page 8 | Basic operations
Page 9 | Fractions
Page 10 | Percentages
Unit 5 | Statistics and Probability
Page 1 | Sampling data (MA)
Page 2 | Recording and representing data
Page 3 | Mean median range and mode
Page 4 | Standard deviation
Unit 4 | Calculus
Diagrams and Graphs
- Tables are a very simple way of storing information that we have gathered in a neat way.
- However, there are often different ways for us to present or sort that data so that it is easier to understand or find patterns.
- We can use different types of diagrams to help us group numbers. Two famous diagrams that are used for this purpose are Carroll diagrams andVenn diagrams.
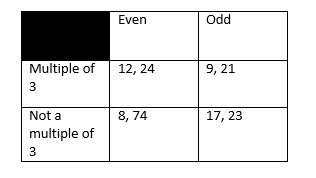
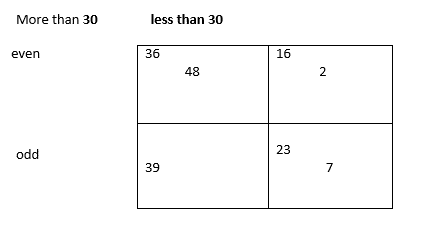
- A Carroll diagram is a table with headings for each column and row describing different numerical qualities. Every number in each column or row must have that quality.
Example 1 :
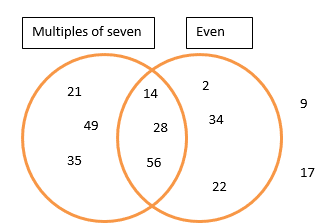
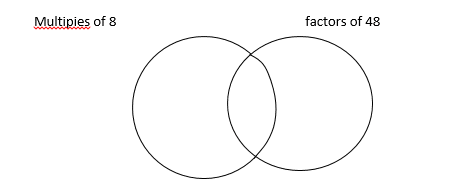
 5. A Venn diagram is made up of circles with each circle containing numbers with a certain property.
6. If a number has more than one of these properties, it will be placed in the space where the circles overlap. If a number doesn’t have any of the properties, it will be placed outside the circles.
Example 2 :
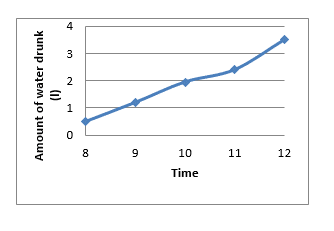
We can use line graphs to illustrate how one quantity will affect how another quantity changes. Measurements will be recorded as points on the graph and then these points are joined together with lines.
Example 3 :
This graph shows the information about the amount of water a person drinks in one day.
1) The following number need to be sorted into a verr diagram- 8, 12, 7, 6, 7, 4, 64, 24
2) This is a Carroll diagrams. Sort the number 8, 17, 43 into it
 3) Elana went for a walk. This is a distance –tune graph for her walk.
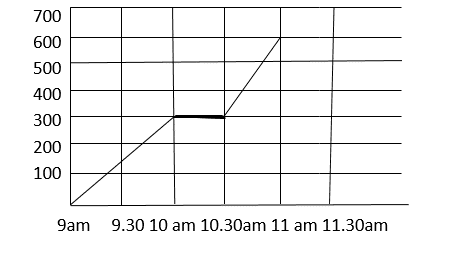
What was happening between 10am & 10.30 am ?
How far did Elaina travel between 10.30 and 11am?
4) Children from three large cities are taking part is a swimming from competition. This table shows the number of children from each city and what they are participating in
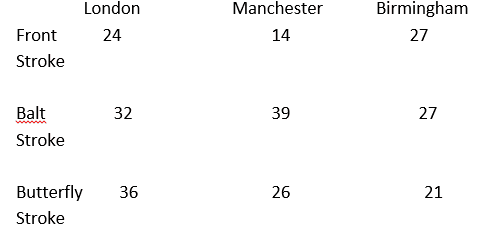
How many children from London are competing in the butterfly store?
How many children from Manchester are competing?
How many more children from Birmingham are doing the front stroke than children from Manchester?